
Massive 17.4% gap on good steady earnings! Into a support zone, with a huge market cap. Cherry on top, it keeps going down until it's down 21% within the first 3 minutes of market open. Got in as it starts to bounce, risking low of day, sold 1/3 as it was reaching the opening price. Sold the rest when I saw a bigger consolidation, the range of the bar was already pretty big so didn't want to get greedy and give back profits.

2 weeks of consolidation around the 200 MA. As they reported steady, good earnings, you can get in at the breakout with a stop at the low of the bar. I wanted a wider stop because of the earnings factor. A couple of days later, it has a massive gap up. Since it had very little pullback from the open, and the gap is so big, you can sell your whole position as it goes up on the same day.

It had a couple of down days before earnings day, followed by a massive 8.5% gap down! Starts off by falling even more on heavy volume. Most of the bars near the bottom are dojis, suggesting it wanted to bounce. Even if you get in late, sell half at the end of the first push and the rest as it starts to pull back, you have decent risk reward.

Really sharp move at the opening, it went vertical for some time. First short opportunity there, and covered after the high of the last bar was broken. Second short in the afternoon, SPY is consolidating - we have a push just below the morning high and start to have lower lows. I took the second trade, sold half after the first push, and the rest after breaking the high of the first green bar. SPY 5m right corner for reference.

It starts with a 5% gap, but it aggressively keeps going down, until it reaches 9% down on a 90 B cap company - that's significant. Getting in 98.7 or like me a little later gives a decent risk reward risking the low of day, but I added after the first consolidation and risking the low of it, around 99.15 and you can sell early into the next spike or wait for the next one with a bit more volume. Taking the second trade had a similar risk reward, but bigger gains. Still optional as the first trade is great in itself.

Strong sector (health tech), with a 2-week consolidation after an initial push with volume. Massive gap after rumors of an acquisition. Sold all of it because usually price stalls after a gap + news like that.

SPY had a sharp drop and started gaining momentum back. VXX lower lows right after that and that was the entry. The bars were bigger and we had a small gap up in price on the 5m bar right before the top. Unfortunately it didn't keep going so I stoped out when we took out the previous high, taking almost half of my risk. The doji at the bottom with big volume made me want to get out early.
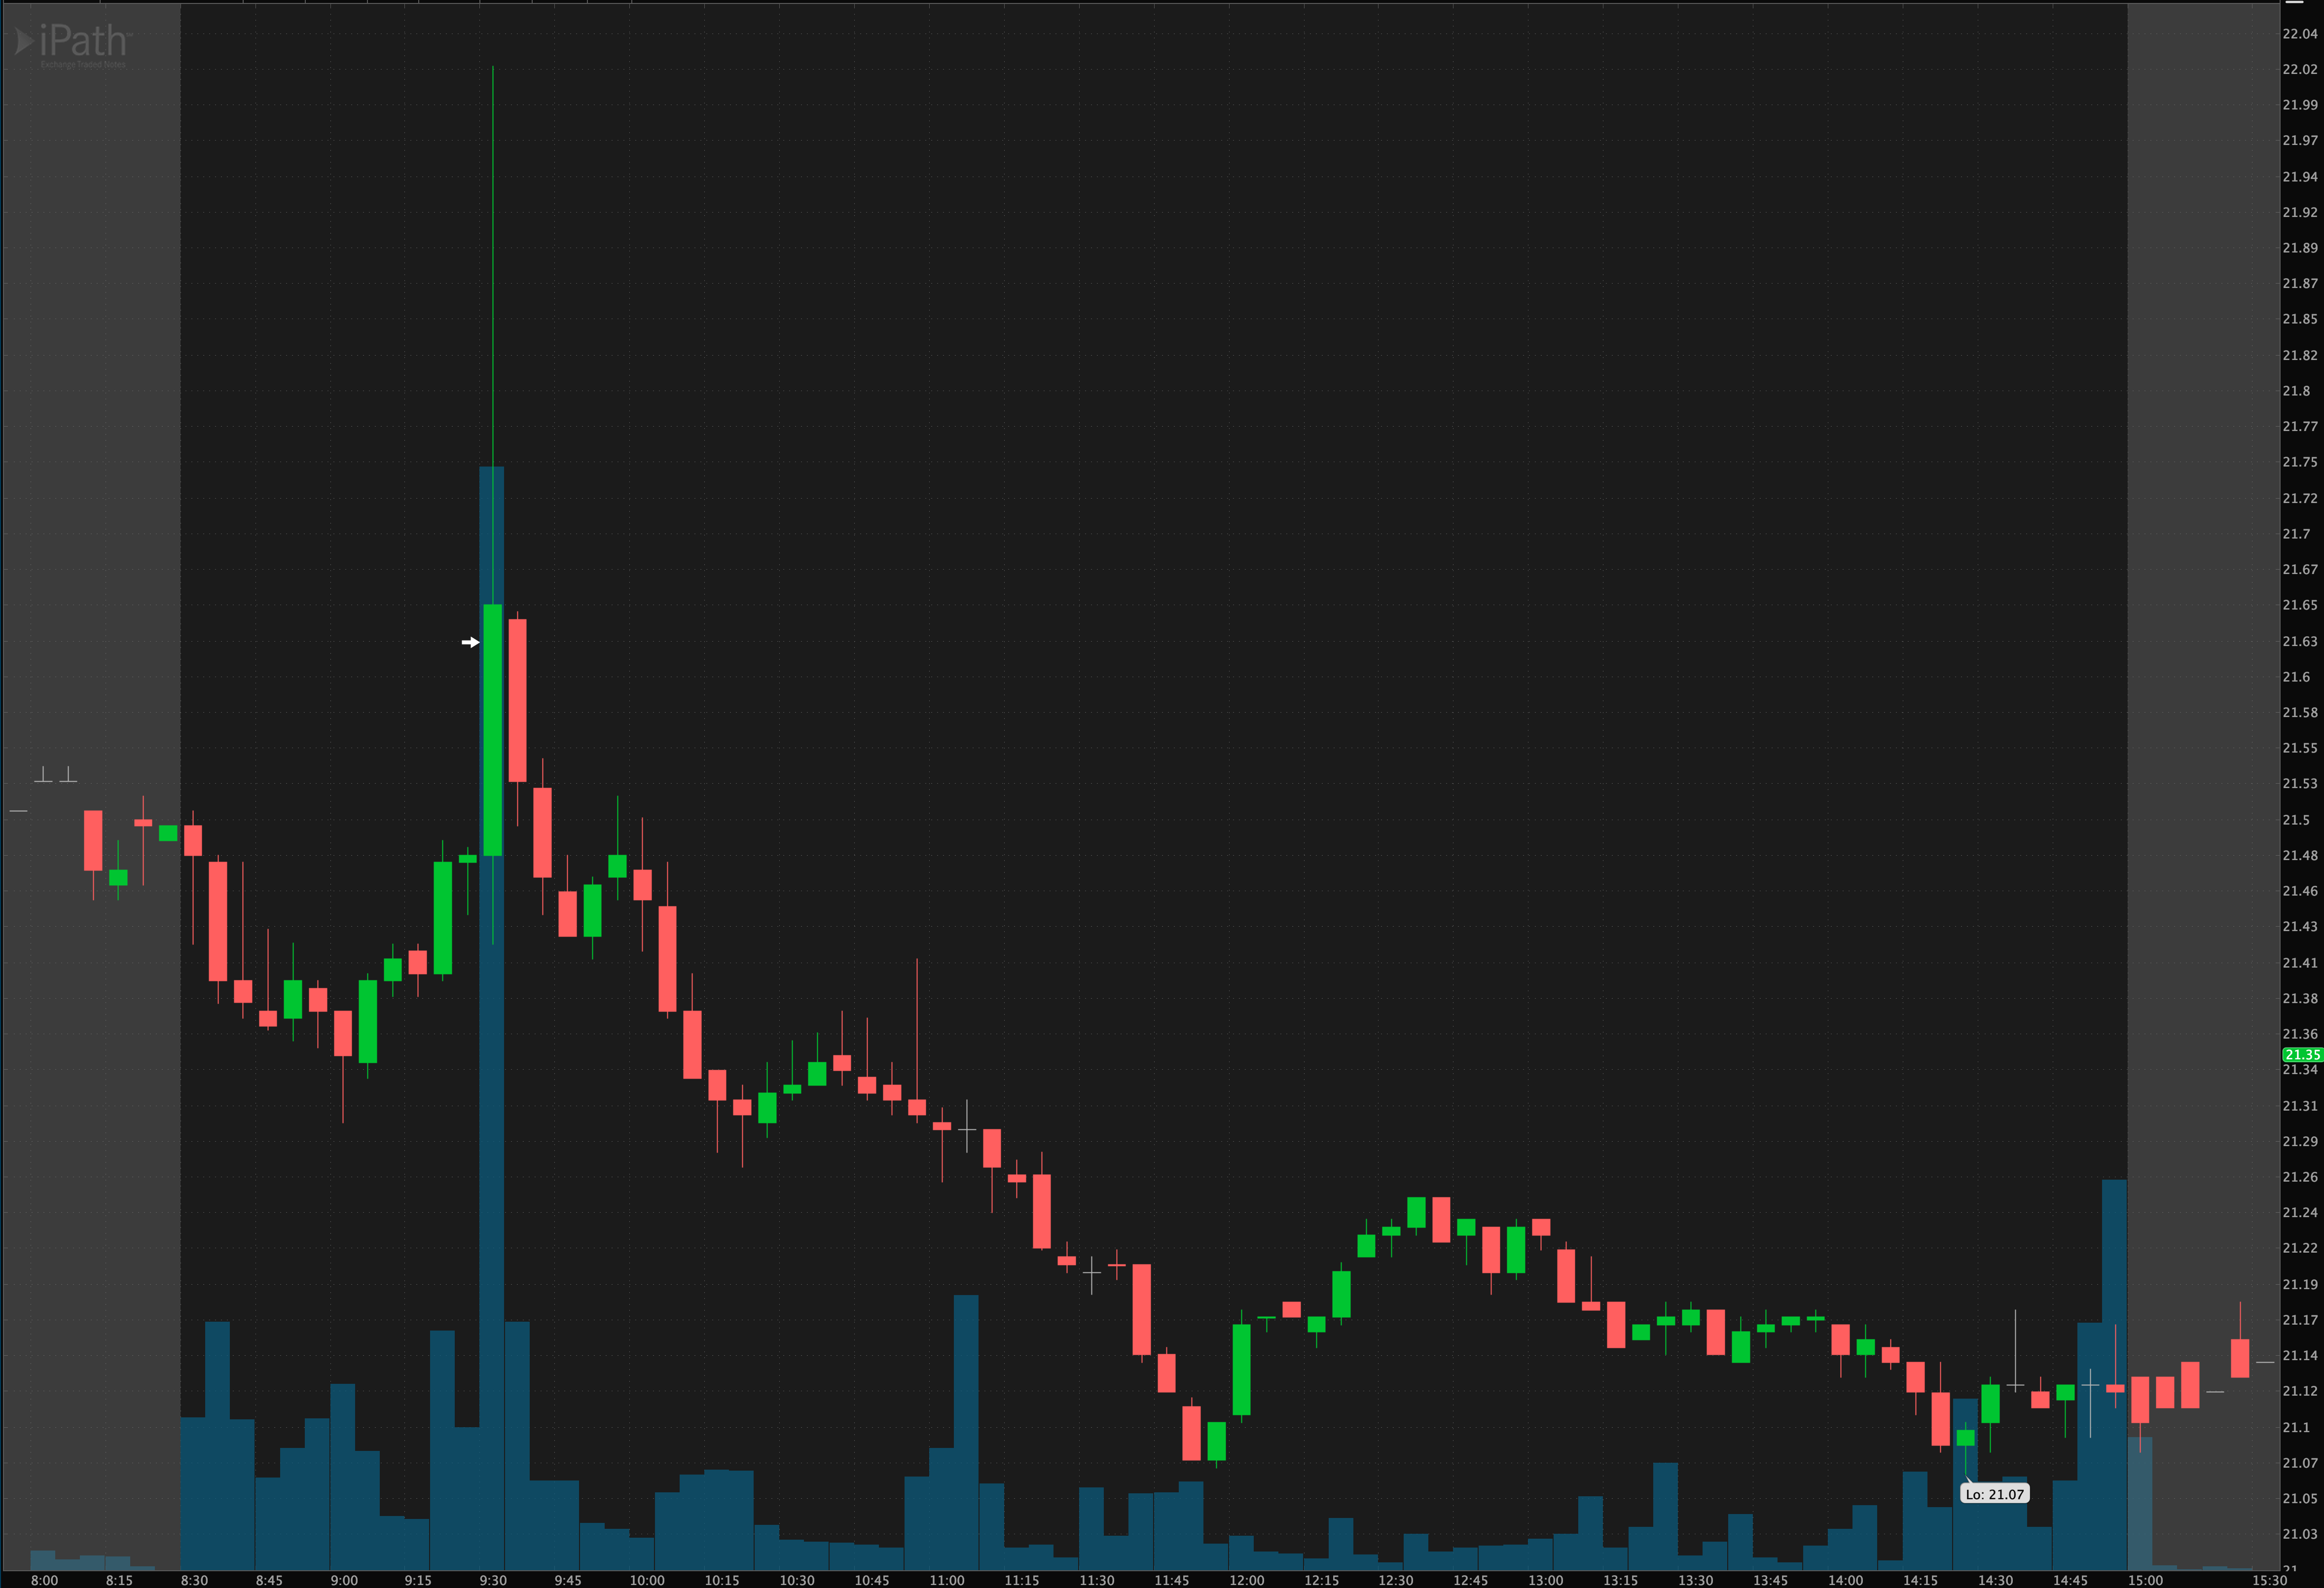
SPY had a sudden drop and I got an alert that RSI for VXX was above 70. I saw it hang around the 21.62 cents for a few seconds which made an easy entry to short into the pop and sell around 3 minutes later And this is how the SPY looked like when VXX spiked, it was a huge dip in less then 1 min

Offering, not good news but the 20% gap overnight on a 1.7 B cap company makes it a good setup. It started strong but I waited for a first deep before getting in. It had excellent risk reward even with a late entry. It had a few red days on the way down, finally ending on a gap to go long into. Daily chart reference.
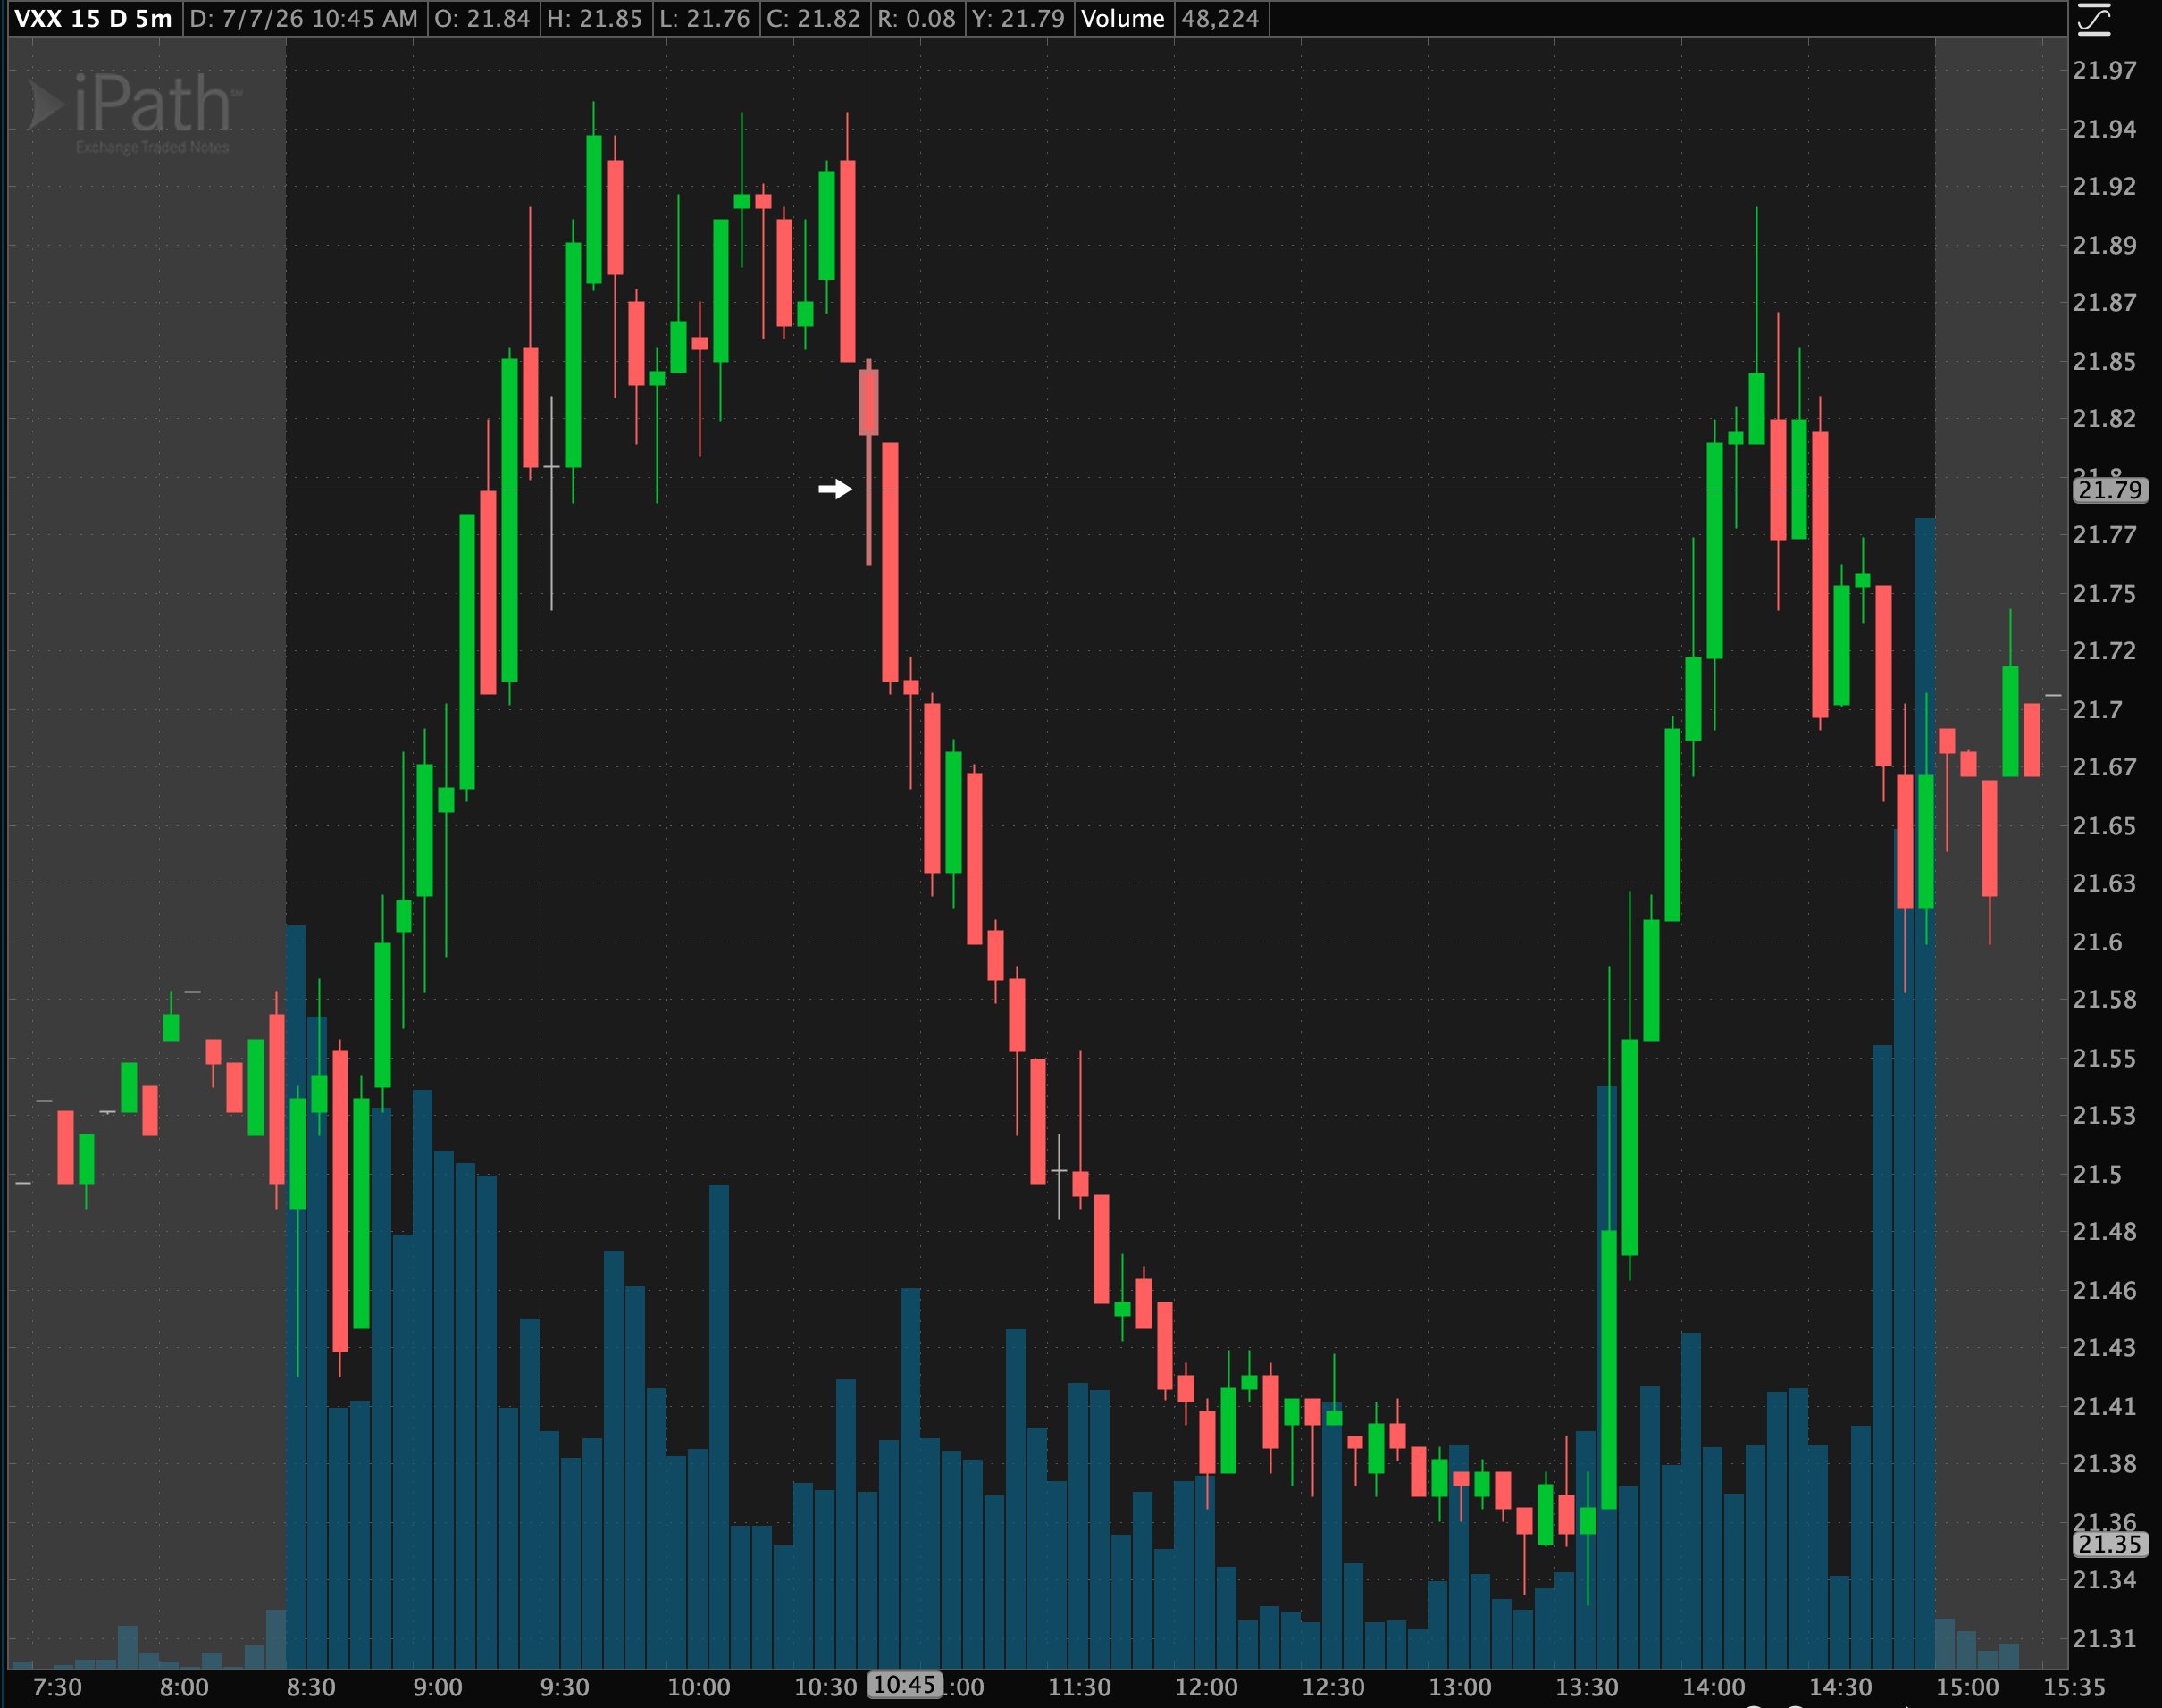
SPY started the day going vertical to the downside, after a good doji it slowed down and started making higher highs. Making a good consolidation on VXX and eventually breakdown from it, having a stop on the top of the consolidation offered a great risk reward on the trade. I got alerted on the first high and waited for it to break down from the next low. Reference SPY chart

They're a software company, right now semiconductors are going down and tech services starting to move up so not the worst sector to go long. It gapped up right on top of the consolidation on good earnings. It had 2 big moves + consolidation before this trade. Moving on top of the 10 MA and consolidation on the 20 MA. It made a double bottom while consolidating. Sold half almost at the top and the rest after it closed below 20 MA after the big drop.

Any pharma stock during COVID days would go up on any news. It makes a doji at the 50 MA as it steadily goes up. You can get in as it breaks the previous 2 bars' high, sell the first part and exit flat, and sell the second part as it makes a gap on the way up to prevent a gap reversal.

Small note before the final trade: it had another entry a few days before, and you would've lost on it after it dropped on the second day. Hot sector, pharma during COVID days. Small gap into a breakout after several weeks of consolidation. Sell some after the third day and the rest after a few weeks, after it finally broke below the 10 MA.

Health tech was the best sector during COVID days. It consolidates for a couple of weeks after a big move and breaks out. Sell the first part a few days later and the rest after it closes below the 10 MA, since it's a fast moving stock.

Any pharma stock during COVID days would go up on any news. It had a good move up and consolidated around the 20 MA. Entry on the break of the consolidation, selling some after 3 days and the rest after breaking the 20 MA gives roughly 2x. But it did go more than 7 times the initial risk, with a stop on the low of day from the entry bar.