VXX — volatility-short
| Event date | 2026-07-07 |
| Timeframe | 5m |
| Volume vs. average | 2.0x |
| Risk Reward | +3.0 |
| Tags | lower-lows |
Summary
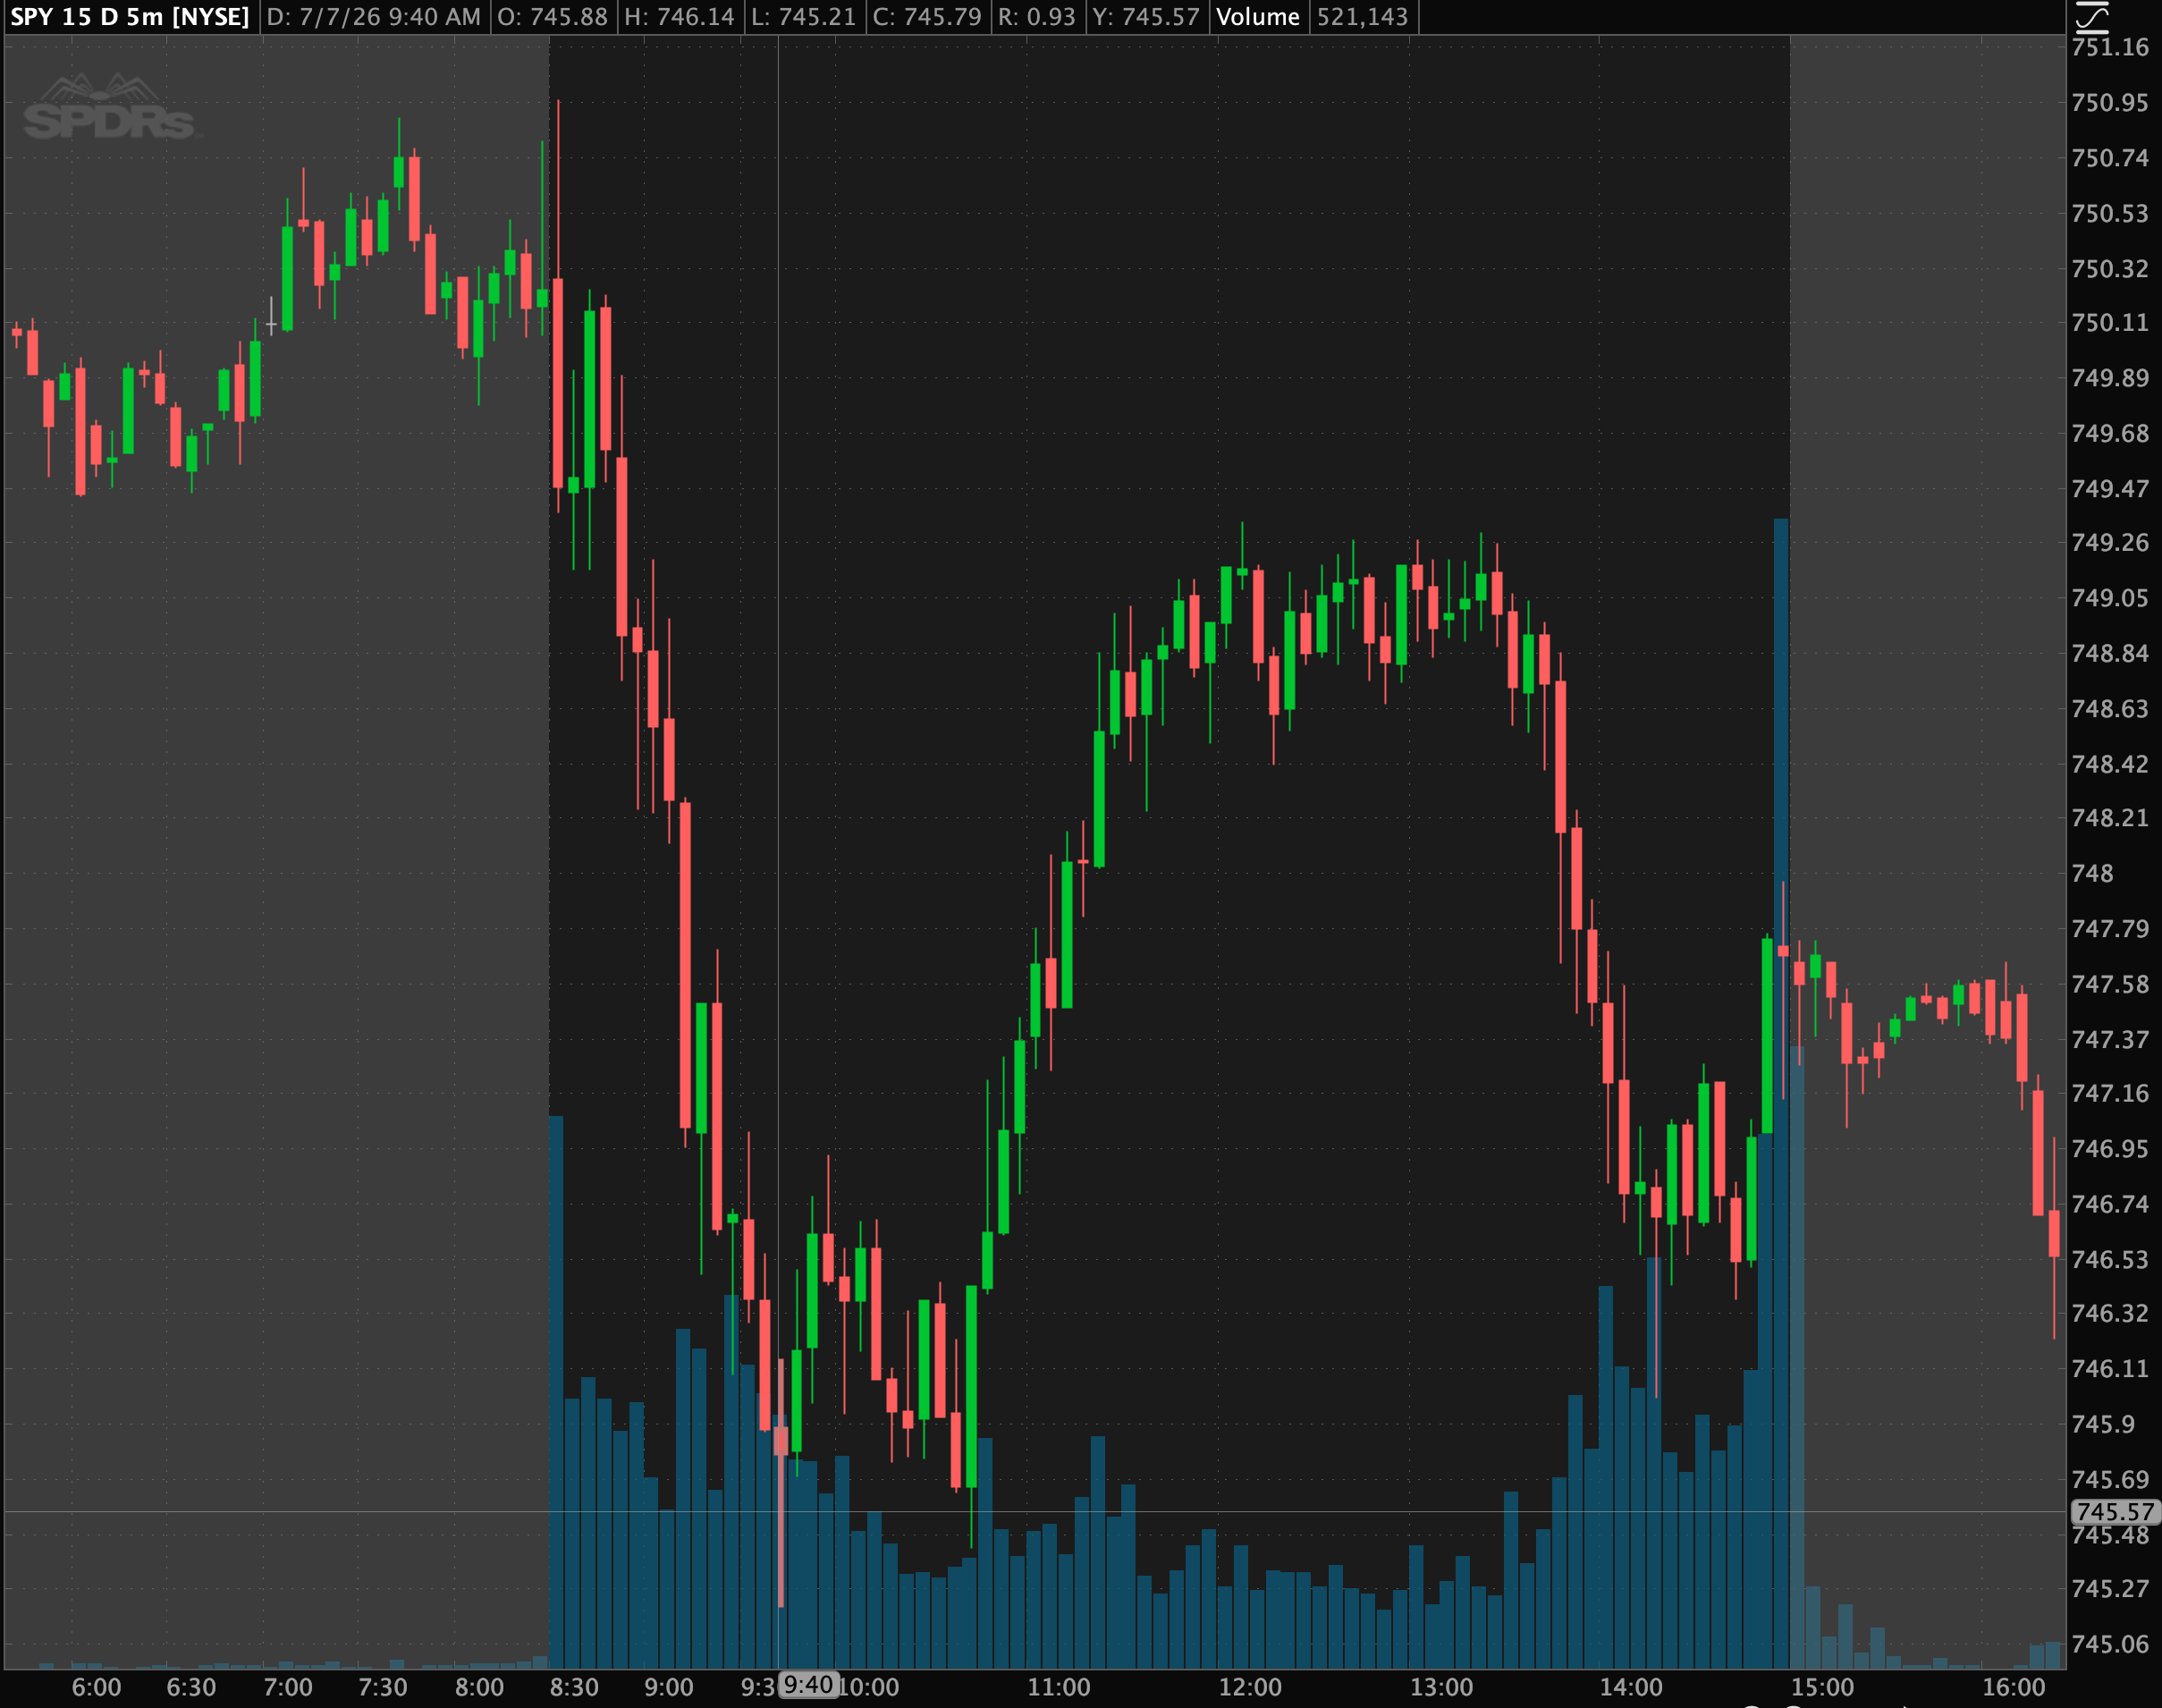
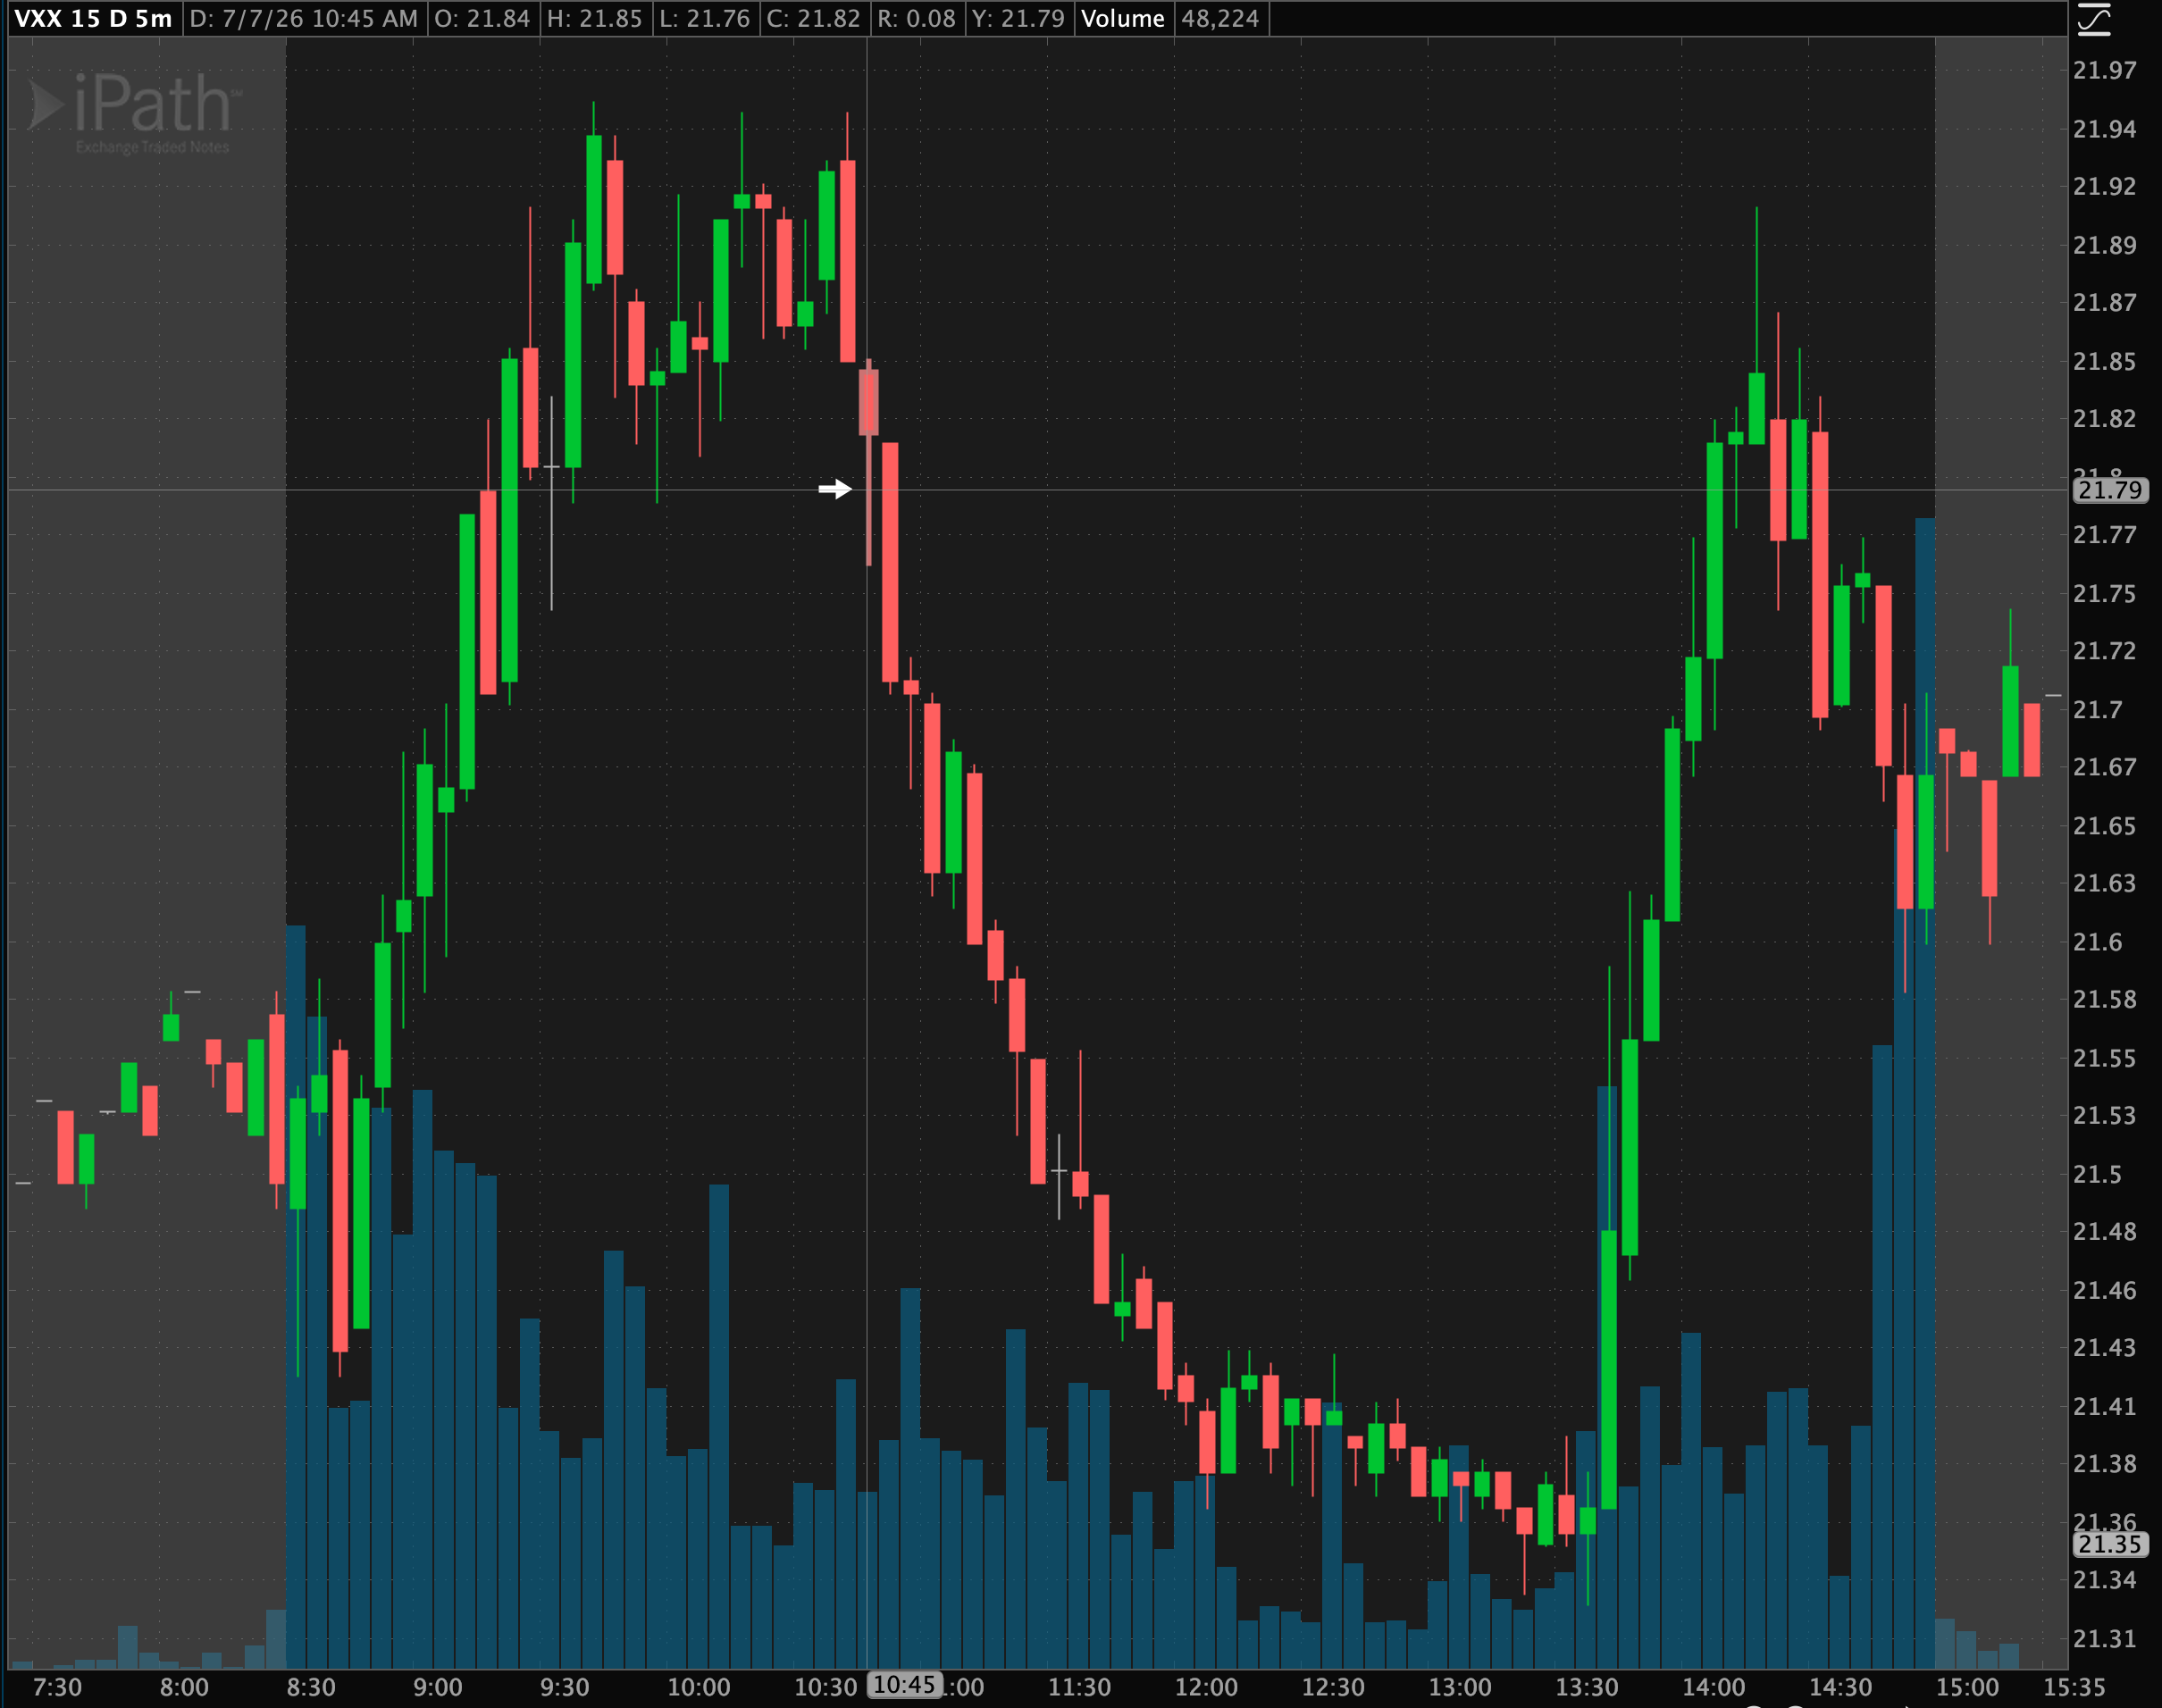
SPY started the day going vertical to the downside, after a good doji it slowed down and started making higher highs. Making a good consolidation on VXX and eventually breakdown from it, having a stop on the top of the consolidation offered a great risk reward on the trade. I got alerted on the first high and waited for it to break down from the next low. Reference SPY chart
Reference