
About the same time it reached the high of day, SPY had a doji with good volume, but it didn't go up too much on VXX, so I didn't want to short yet. Instead, I waited for it to break the uptrend to get in. I didn't like how slowly it was dropping, so I used a tight stop once it reached around 1x reward.

Second wave of the day ended in a big-volume bar, similar look on SPY. Consolidated for a few bars, and you get an entry at the low of the consolidation. The push looked pretty aggressive, so lock in some and move the stop to the entry price to finish the trade and protect profits.

It goes up all morning, ending on a climax around the same time SPY capitulates on big volume. Short as it starts to come down from that, selling some on the next big push, and the rest as it bounces back up.

Really sharp move at the opening, it went vertical for some time. First short opportunity there, and covered after the high of the last bar was broken. Second short in the afternoon, SPY is consolidating - we have a push just below the morning high and start to have lower lows. I took the second trade, sold half after the first push, and the rest after breaking the high of the first green bar. SPY 5m right corner for reference.

SPY had a sharp drop and started gaining momentum back. VXX lower lows right after that and that was the entry. The bars were bigger and we had a small gap up in price on the 5m bar right before the top. Unfortunately it didn't keep going so I stoped out when we took out the previous high, taking almost half of my risk. The doji at the bottom with big volume made me want to get out early.
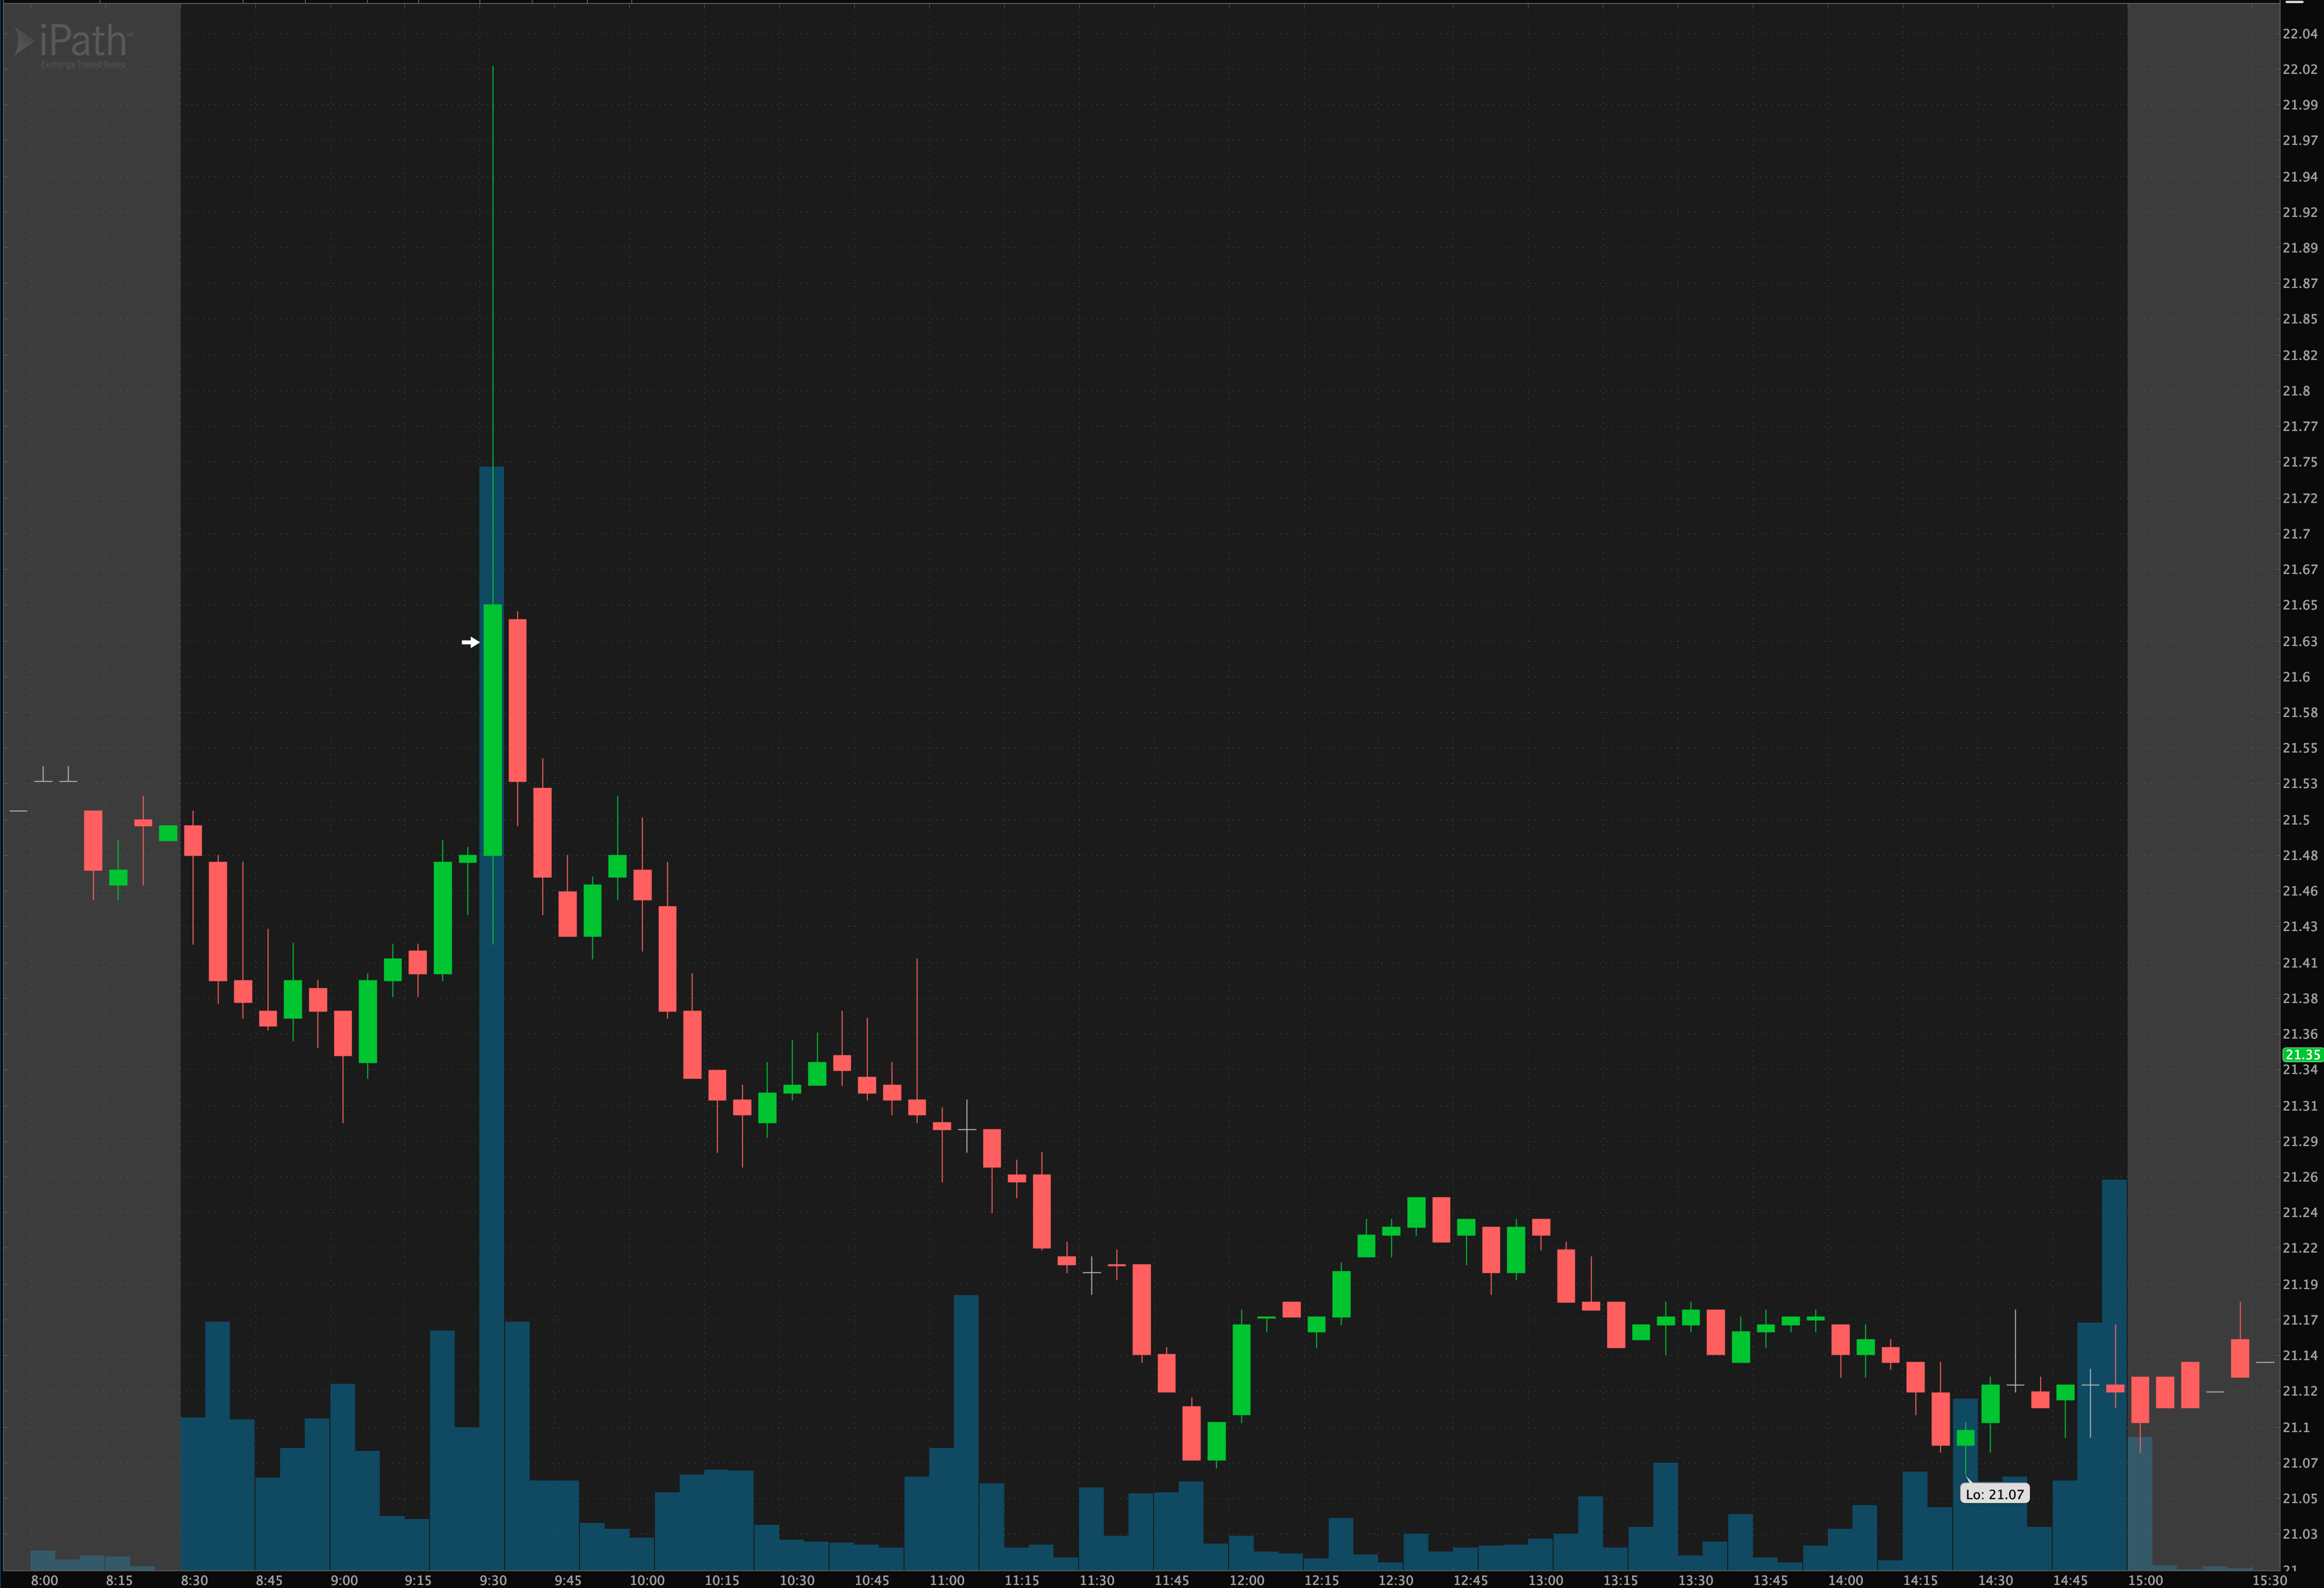
SPY had a sudden drop and I got an alert that RSI for VXX was above 70. I saw it hang around the 21.62 cents for a few seconds which made an easy entry to short into the pop and sell around 3 minutes later And this is how the SPY looked like when VXX spiked, it was a huge dip in less then 1 min
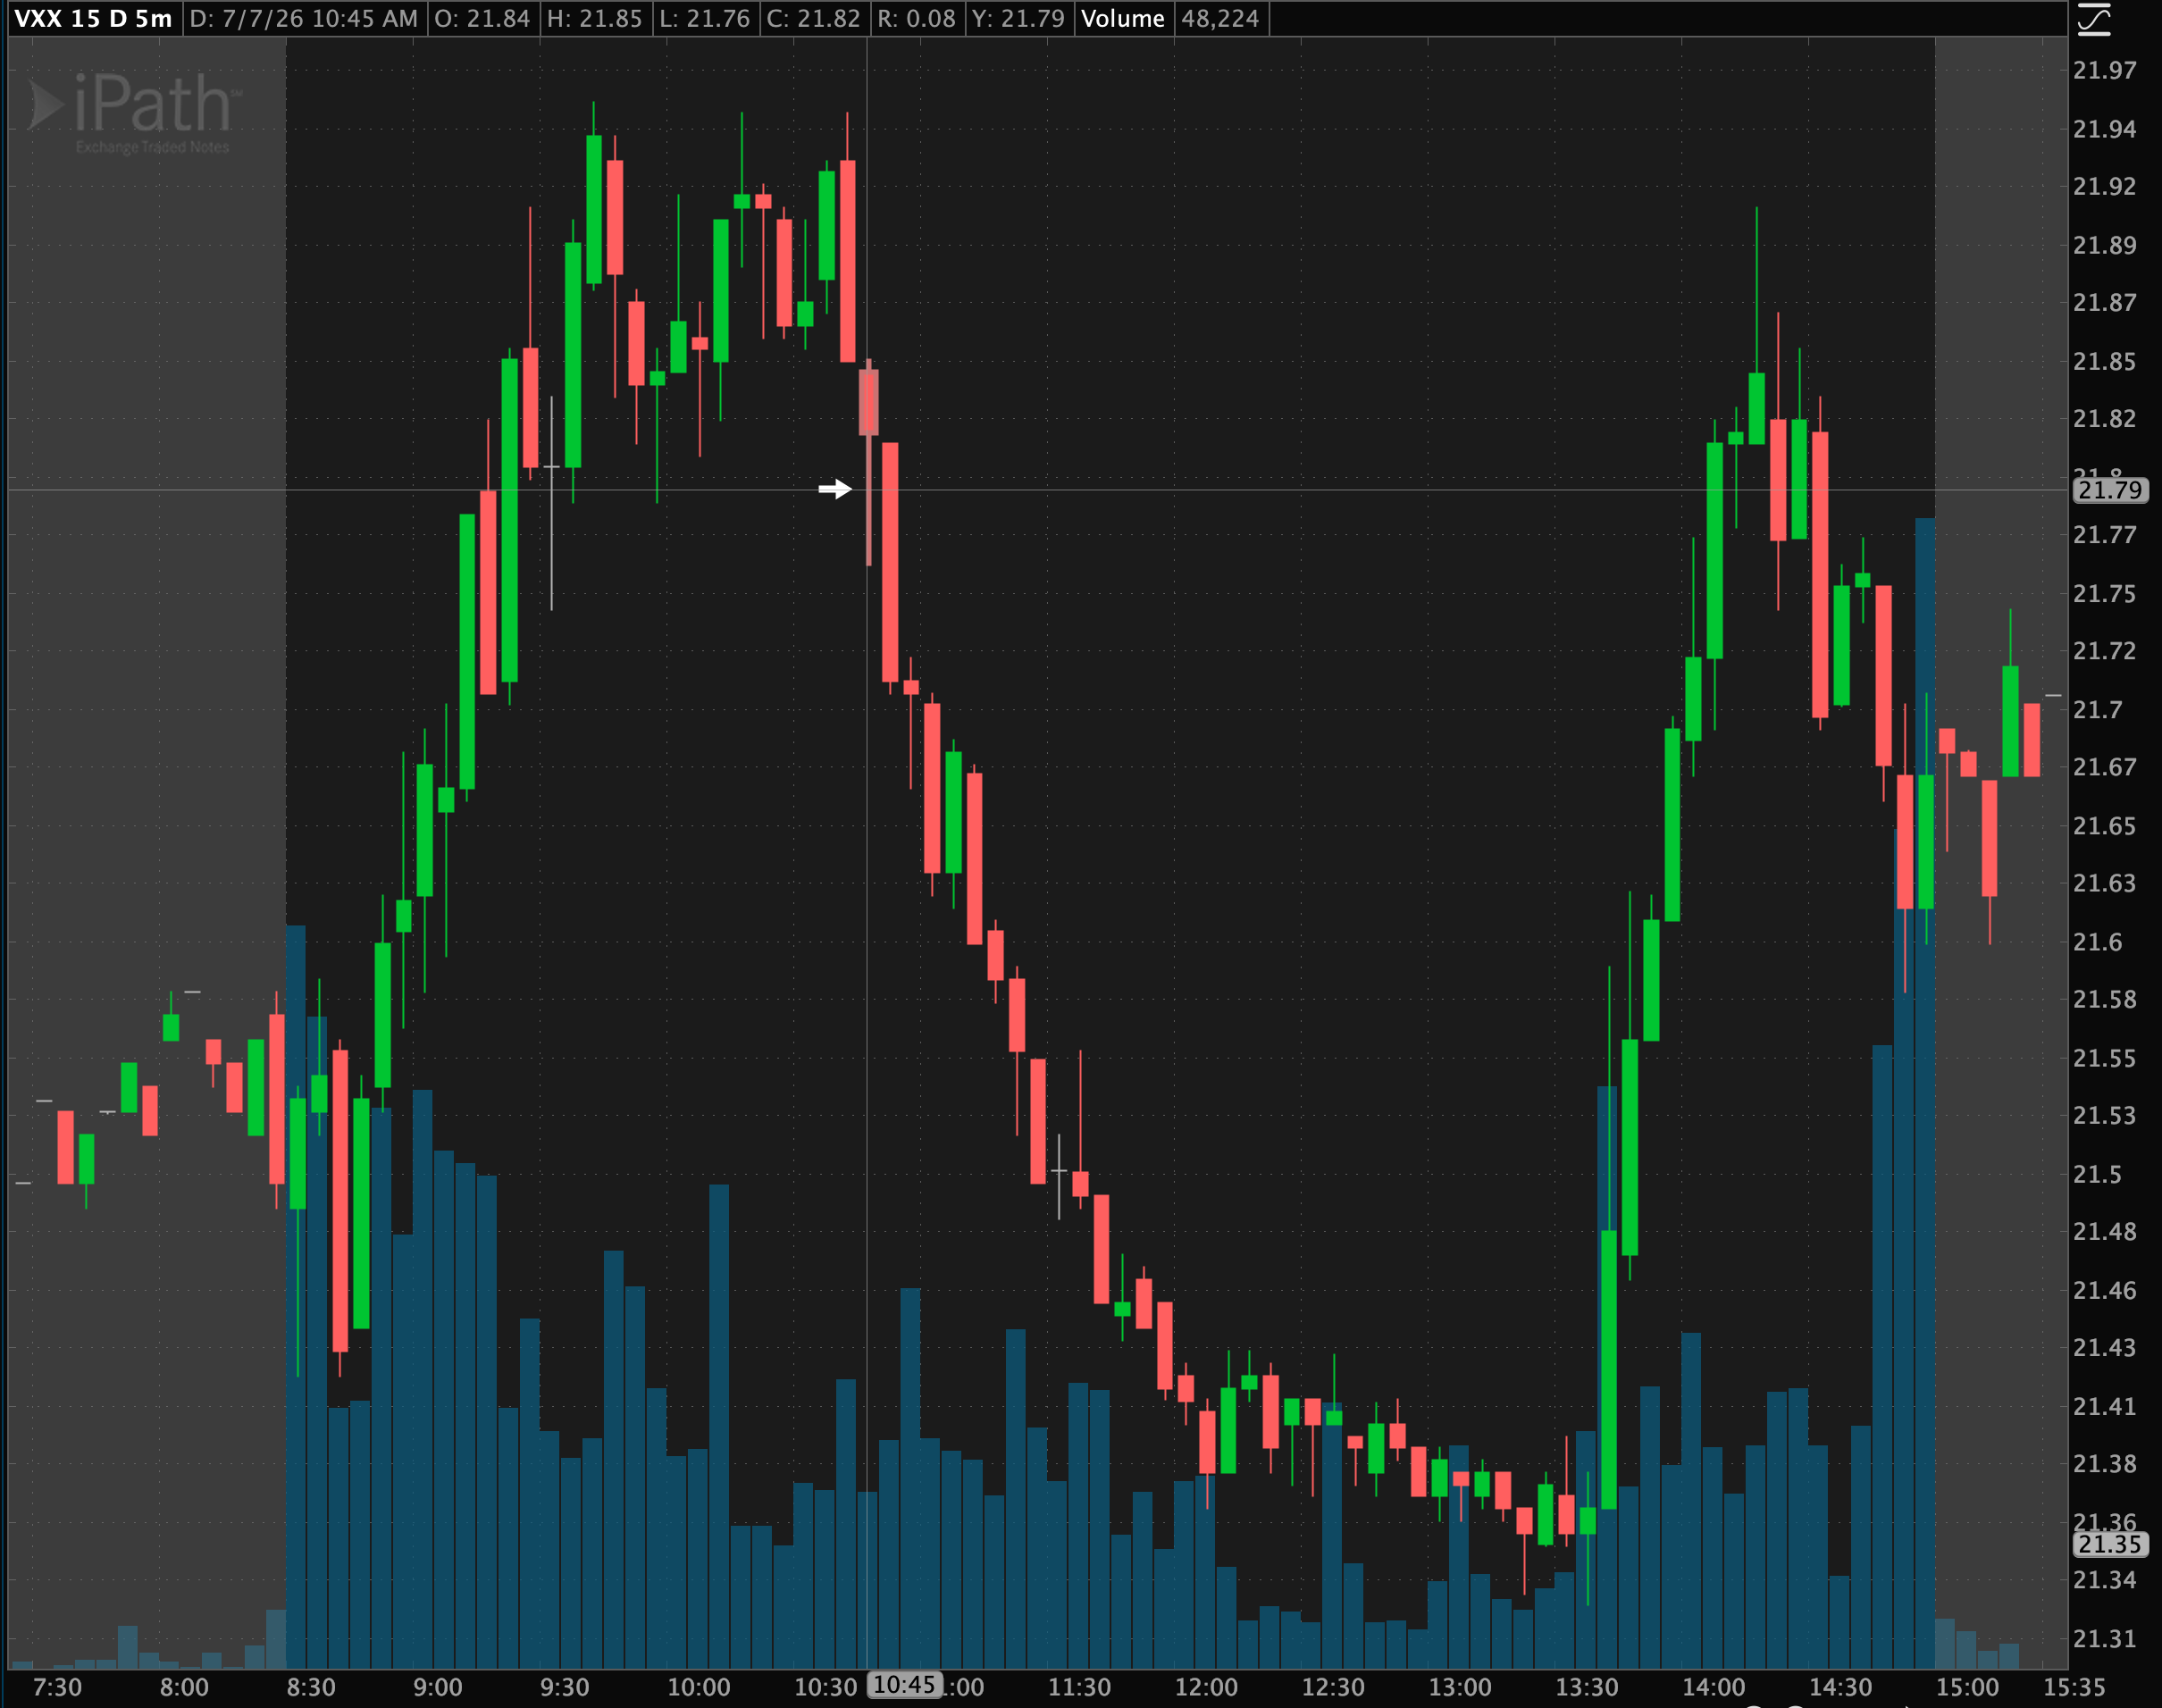
SPY started the day going vertical to the downside, after a good doji it slowed down and started making higher highs. Making a good consolidation on VXX and eventually breakdown from it, having a stop on the top of the consolidation offered a great risk reward on the trade. I got alerted on the first high and waited for it to break down from the next low. Reference SPY chart